How to Read an Audiogram and Determine Degrees of Hearing Loss
What information is on an audiogram and what does it mean for the person’s hearing ability?
The amount (or degree) of hearing loss a person experiences is based on hearing sensitivity. In order to determine a person’s degree of hearing loss, their hearing thresholds must be determined. Hearing thresholds are defined as the lowest level sound that can be heard 50% of the time. The decibel (or dB) is the unit of intensity used to describe hearing sensitivity. During a diagnostic hearing evaluation the threshold is measured at different frequencies (or Hertz, Hz) in each ear.
The degree of hearing loss is expressed by the difference between a person’s threshold and the average threshold for people with normal sensitivity. For example, persons with mild hearing loss have thresholds that are 25 to 40 dB higher than the thresholds for those with normal hearing when tested using different at several frequencies. The list below outlines different hearing loss thresholds as they are determined in relation to an individual with a normal hearing threshold.
Moderate hearing loss: 40 to 55 dB higher than normal
Moderate-to-severe hearing loss: 55 to 70 dB higher than normal
Severe hearing loss: 70 to 90 dB higher than normal
Profound loss: 90 dB or more
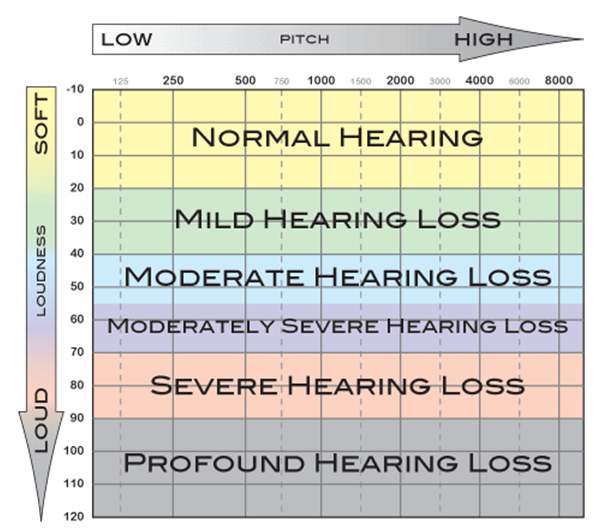

The graph to the left represents a blank audiogram illustrates the degrees of hearing loss listed above. Frequency is plotted at the top of the graph, ranging from low frequencies(250 Hz) on the left to high frequencies (8000 Hz) on the right. Sound level, in dB, is plotted on the left side of the graph and ranges from very faint sounds (-10 dB) at the top to very intense sounds (120 dB) at the bottom.
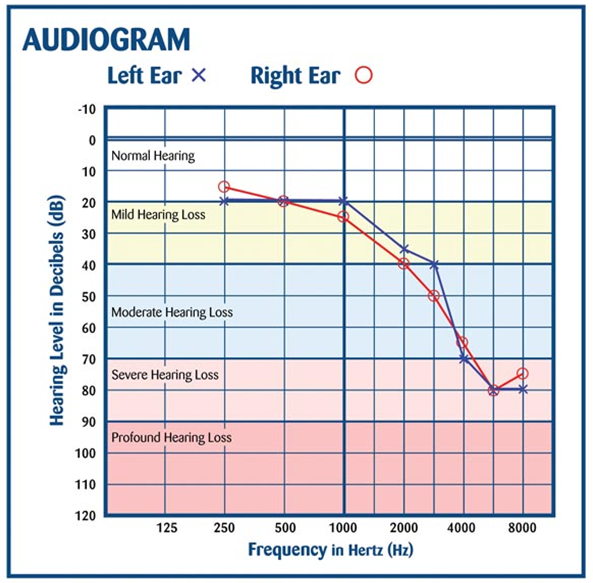
Understanding the information shown on an audiogram is easy. Let’s look at an example. In the audiogram below, hearing thresholds for the right ear are represented by red circles and thresholds for the left ear are represented by the blue X. In the right ear, this person has normal hearing in the lower pitches indicated by a red circle corresponding to 15 dB at 250 Hz and 20 dB at 500 Hz. Hearing thresholds in the high pitches fall into the severe degree of hearing loss, as the threshold at 2000 Hz is 40 dB, 65 dB at 4000 Hz and 75 dB at 8000 Hz. Can you determine the degree of hearing loss for the left ear?
Image credits:
http://alphaonenow.com/userfiles/image/aud_audiogram.gif
http://baasnotes.com/blog/wp-content/uploads/2008/10/audiogram-presbyacusis-rgb.jpg






Leave a Reply